
Financial Review

INUUSIRVIK COMMUNITY WELLNESS HUB
Baffin Island, Canada
Insulated Building Envelopes
Morin Pulse Series P-1, P-2, P-3, P-4, P-9 panels
Photography: Andrew Latreille
Overview of result
Group revenue increased by 7% to €9.2bn (2024: €8.6bn) and trading profit increased by 5% to €955.1m (2024: €906.7m) with a decrease of 10 basis points in the Group’s trading profit margin to 10.4% (2024: 10.5%). Basic EPS for the year was 370.0 cent (2024: 365.2 cent), representing an increase of 1.3%.
The Group’s underlying sales and trading profit growth by operating segment are set out below:
Insulated Building Envelopes
- Revenue +5.8% yoy
(-1.0% underlying, -1.6% currency, +8.4% M&A). - EBITA +2.9% yoy
(+0.4% underlying, -2.4% currency, +4.9% M&A).
Advnsys
- Revenue +12.0% yoy
(+6.6% underlying, -1.7% currency, +7.1% M&A). - EBITA +17.1% yoy
(+11.3% underlying, -2.4% currency, +8.2% M&A).

SILT HOTEL
Middelkerke, Belgium
Advnsys
Colt FireCurtain FM1; Axial fans; Firelight Duo smoke vent; Duo Therma smoke vent; Damper units; CO2 detection devices
Summary numbers
Revenue
up 7% to €9.2bn,
(pre-currency,
up 9%).
Trading profit1
up 5% to €955m,
(up 8% pre-currency).
Acquisitions
contributed 8% to sales
growth and 6% to
trading profit growth.
Profit after tax of €716m
(2024: €691m).
Basic EPS
up 1.3% to 370 cent. Diluted EPS up 1.4% to 367 cent.
Final dividend per share of 29.2 cent (2024: 28.5 cent) giving a total dividend for the year of 55.5 cent (2024: 54.8 cent).
Strong free cash generation of €429.3m (2024: €509.4m).
Scope 1 and 2 GHG
emissions reduction
from 2024 to 2025.
Effective tax rate of 16.0% (2024: 17.0%).
Year end net debt2 of €1,883.6m (2024: €1,573.0m). Net debt to EBITDA3 of 1.65x (2024: 1.47x).
1. Operating profit before amortisation of intangibles.
2. Net debt pre-IFRS 16 per banking covenants.
3. Net debt to EBITDA ratio is pre-IFRS 16 per banking covenants.

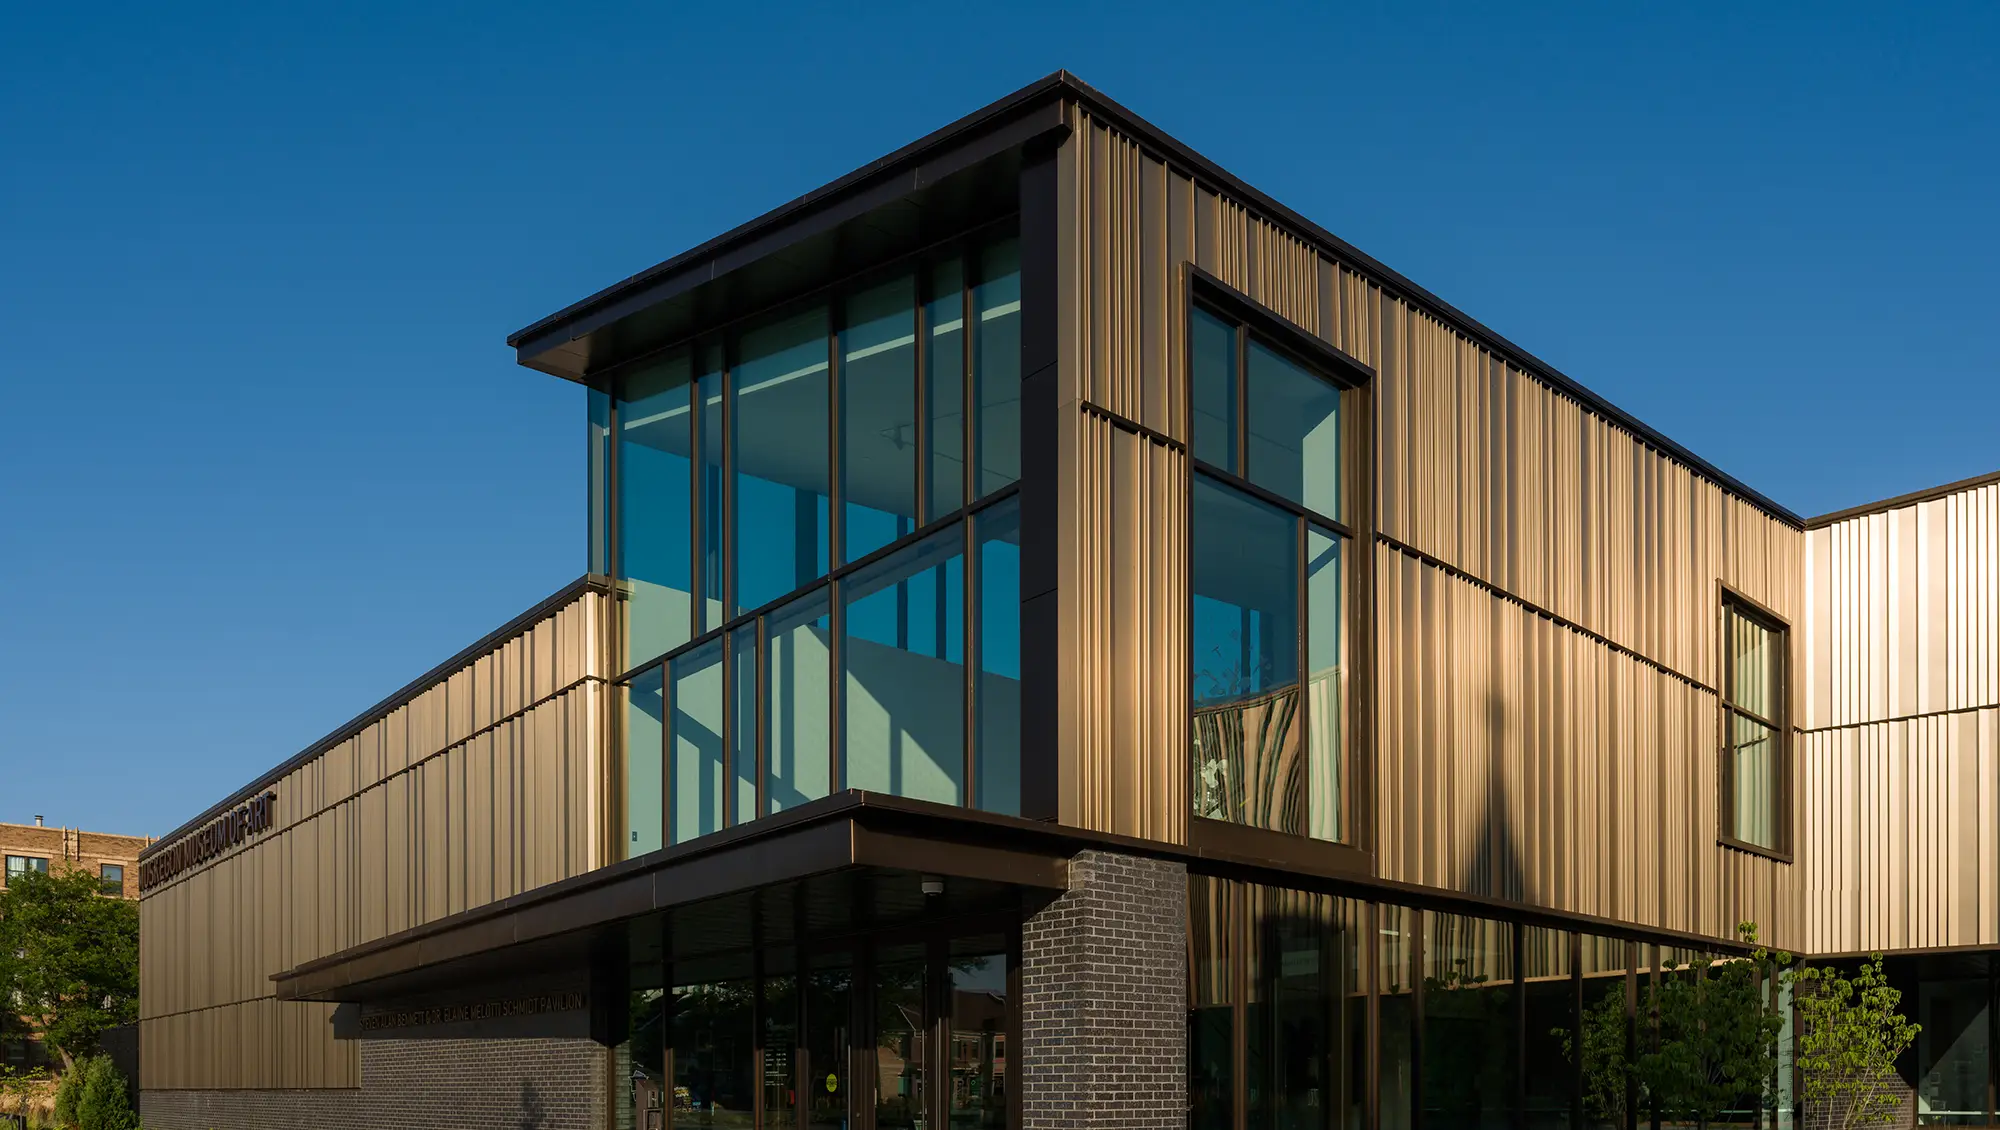
MUSKEGON MUSEUM OF ART
Michigan, USA
Insulated Building Envelopes
Morin Classic F-12 profiles; Pulse P-1, P-2, P-3, P-4 panels

Growth over the last five years


Looking Ahead
Net finance costs
Net finance costs for the year increased by €22.1m to €54.1m (2024: €32.0m).
Dividends and share buyback
The total dividend for 2025 is 55.5 cent compared to 54.8 cent for 2024.
During the year the Group purchased 2,198,861 of its own shares for an average price of €67.58 per share. These shares have been cancelled.
Intangible assets and goodwill
Intangible assets and goodwill increased during the year by €169.7m to €3,774.6m (2024: €3,604.9m).
Basic EPS growth
The growth in EPS is accounted for primarily by a 5% increase in trading profit partially offset by the increase in interest payable and an increase in profit attributed to non-controlling interests.
Sales performance
+7% (2024: +6%) was driven by an 8% contribution from acquisitions, and modest increase in underlying sales, partially offset by currency translation of 2%.
Free cashflow
Free cashflow of €429.3m (2024: €509.4m). Working capital at year end was €1,125.1m (2024: €1,027.2m) and represents 11.9% (2024: 11.4%) of annualised sales based on fourth quarter sales.
ROCE
Return on capital employed of 14.1% (2024: 14.4%). The returns are 14.3% after annualising the impact of acquisitions.
Net debt to EBITDA
Ratio of 1.65x (2024: 1.47x) is comfortably less than the Group’s banking covenant of 3.5x in both 2025 and 2024. The calculation is pre-IFRS 16 in accordance with the Group’s banking covenants.
Geoff Doherty
Chief Financial Officer


